

Spectrum analyzer#
A Spectrum analyzer performs spectral analysis to decompose complex signals into simple harmonic components (frequencies). The tool allows you to transform time data into an amplitude or power spectrum using windows to minimize spectral leakage, and also calculate the signal-to-noise ratio (SNR).
The tool’s functionality is that the user selects a block and output port from the schematic, and then enters some parameters for analysis (see Fig. 2 below):
Time interval start, [s], from the start of the simulation, after which the signal is captured for analysis. Allows for skipping transient processes.
Analysis mode- the ability to switch between
DefaultandHarmonicsmodes.Fundamental frequency, [Hz], - the lowest frequency at which the signal repeats, available when selecting
Analysis mode-Harmonics.Number of harmonics on the graph, available when selecting
Analysis mode-Harmonics.Number of periods for analysis. This determines the duration of the FFT window and is available when selecting
Harmonicsas theAnalysis mode.Number of FFT points - is responsible for the balance between the accuracy of frequency determination and the accuracy of time determination.
Calculate THD - calculates the total harmonic distortion.
The desired frequency resolution when performing the analysis. This determines how fine the frequency details can be resolved in the resulting spectrum.
Maximum frequency, [Hz], which must be correctly represented in the spectrum.
The window type applied to the time signal before the FFT to reduce spectral leakage. Possible values:
Rectangular;
Hann;
Hamming;
Blackman;
Kaiser (Kaiser window shape parameter (β). Affects the trade-off between the main lobe width and the side lobe level. Only used if the Kaiser window function is selected).
Magnitude or power:
Magnitude;
Power (the value is calculated as (Amplitude²) / (2 * referenceLoad)).
Reference load, Ohm (to calculate power from amplitude: Power = Amplitude² / (2 * referenceLoad). Default = 1).
Display format:
dB(decibels) orLinear(For amplitude in dB: 20·log10(Amplitude), for power: 10·log10(Power)).
Properties related to SNR:
An (on/off) flag that determines whether the signal-to-noise ratio (SNR) should be calculated based on the specified thresholds. The result is stored in the snr field of the response.
Noise threshold, [dB], relative to the median noise level. If a spectral component exceeds the median + Signal threshold, it is considered as signal (useful component) when calculating SNR.
Signal threshold, [dB], to expand the signal region: all adjacent bins whose level is above the median + Noise threshold are also considered signal, not noise.
IP3 - calculate the intersection point of the third orde.
After setting all parameters, the Build chart button of the dependence of the amplitude [dB] on the frequency [Hz] is activated, and also displays the SNR value (if this was selected by the user).
Important
Parameter restrictions:
Name |
Description |
Mandatory |
Limitation |
|---|---|---|---|
Time interval start, [s] |
Time offset (in seconds) from the start of the signal before FFT begins. |
yes |
≥ 0 |
Analysis mode: |
Allows you to select the analysis mode |
no |
When you select the harmonics mode, the following parameters become unavailable: |
Fundamental frequency, [Hz] |
The lowest frequency at which the signal repeats, available when Analysis mode - |
yes |
> 0 |
Number of harmonics |
The number of harmonics on the chart, available when Analysis mode - |
yes |
≥ 1 |
Number of periods |
The number of periods for analysis. Defines the duration of the FFT window, available when Analysis mode - |
yes |
≥ 1 |
Number of FFT points |
The size of the data block (samples) that the algorithm processes at a time. This property is responsible for the balance between frequency detection accuracy and time detection accuracy. |
yes |
Select from the drop-down list |
Calculate THD |
Calculate the harmonic distortion coefficient. Available when Analysis mode - |
no |
on/off |
Sets the reference spacing between points on the chart. The program will recalculate and change the simulation time step for the entire project so that the spectrum strictly matches this computational grid. |
yes |
> 0 |
|
Maximum frequency, [Hz] |
Maximum expected frequency. Limits the output spectrum on the chart. |
yes |
> Минимально допустимого разрешения спектра |
Edge smoothing function for the sample to reduce spectral leakage. |
yes |
Select from the drop-down list |
|
Beta parameter |
Beta coefficient for adjusting the main lobe width of the Kaiser window. |
optional |
\(>\) 0, active only when |
Display choice: Magnitude or Power. |
yes |
Select from the drop-down list |
|
Reference load, [Ohm] |
Resistance value [Ohm] for power spectrum calculation. |
optional |
\(>\) 0, active only when selecting |
Display format |
Units of the vertical axis. |
yes |
Choose from two options |
Enable automatic SNR calculation. |
yes |
on/off |
|
Signal threshold, [dB] |
Exceedance above the noise level (in [dB]) for signal peak detection. |
optional |
\(>\) 0, active only when |
Noise threshold, [dB] |
Threshold (in [dB]) for determining the width of the signal frequency peak. |
optional |
\(>\) 0, active only when |
IP3 |
Calculate the intersection point of the third order |
optional |
on/off |
The Spectrum analyzer tool is used by clicking on the Spectrum analyzer button, which is located in the Tools tab of the bottom panel in the Common section, Fig. 1:
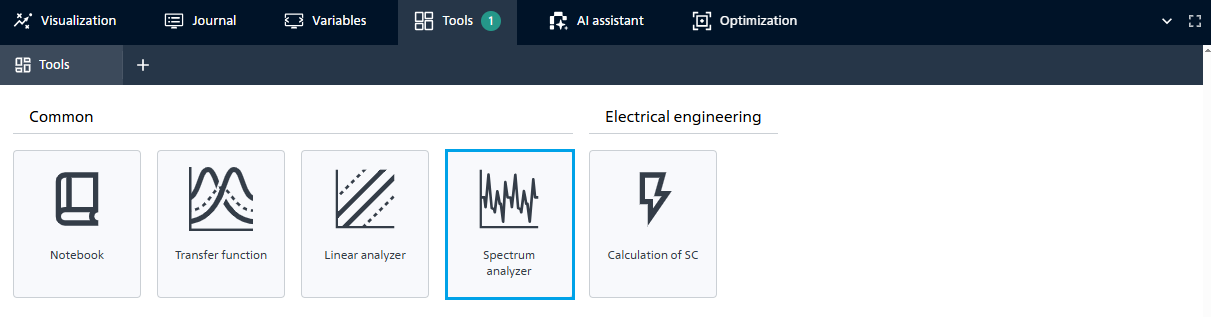
Fig. 1 Spectrum analyzer#
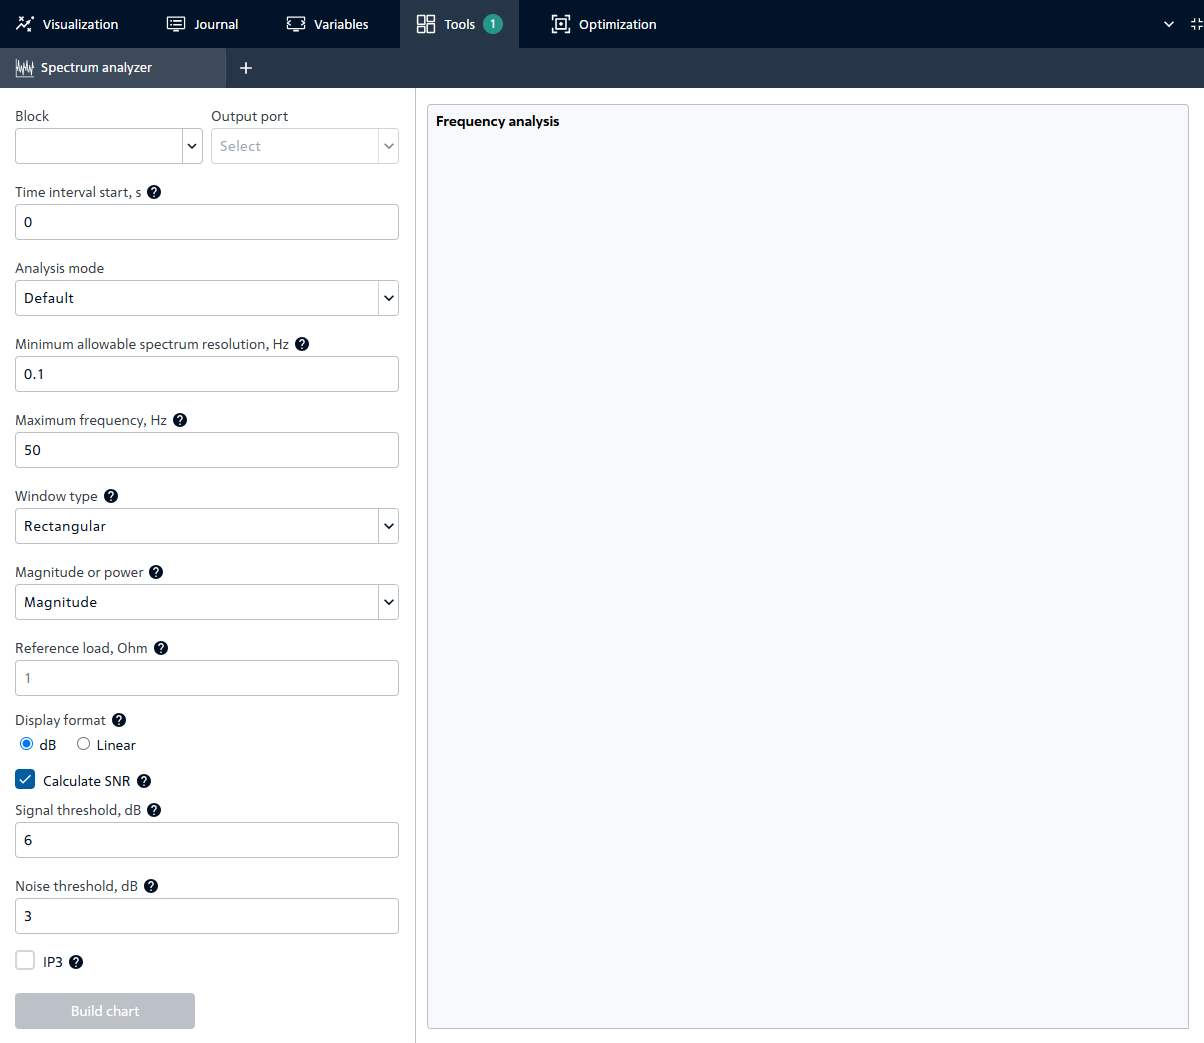
Fig. 2 Setting parameters#