

Transfer function#
The tool – Transfer function, is used by clicking on the Transfer function button, located in the Common section of the Tools tab (Fig. 1):
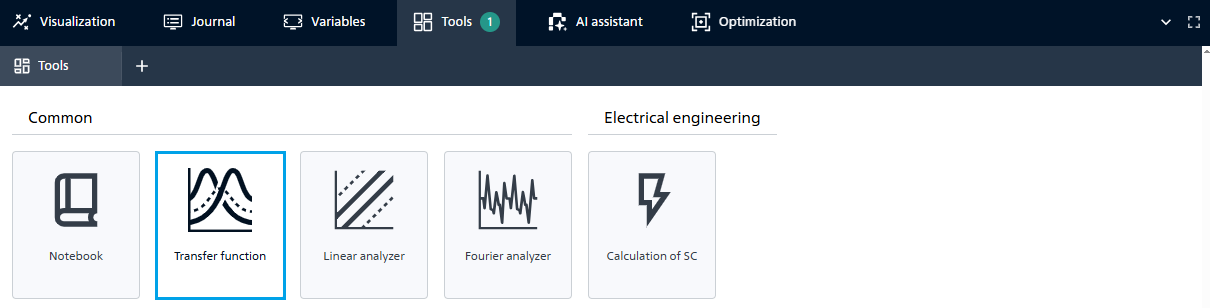
Fig. 1 Transfer function#
This tool is used to analyze and evaluate the performance of electronic devices. It shows how the amplitude and phase of the output signal changes as the input signal frequency changes. This allows one to understand how the device responds to different frequencies and identify potential distortions or performance issues.
1. Setting up a schedule#
The output graph is configured by setting the parameters shown in Fig. 2:
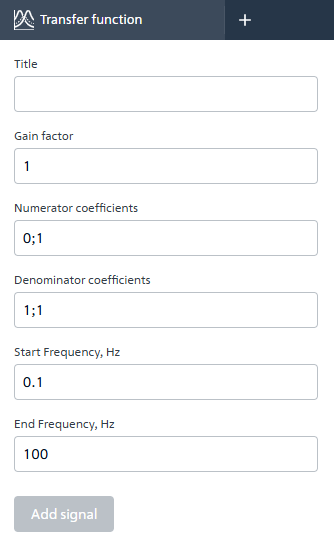
Fig. 2 Graph parameters#
Parameter name |
Default value |
Description |
|---|---|---|
- |
Text field, up to 50 characters |
|
Gain factor |
1 |
Supports fractional values, units of measurement - linear coefficient |
0;1 |
Input format: numbers separated by semicolons, for example: 1; 0.5; -0.2 |
|
1;1 |
Input format: numbers separated by semicolons, for example: 1; 0.5; -0.2 |
|
Start Frequency, Hz |
0.1 |
Numeric field, minimum value: 0.01 [Hz] |
End Frequency, Hz |
100 |
Numeric field |
inactive |
Button for adding graphs |
2. Errors when entering parameters#
Cause of occurrence |
Action |
Message |
|---|---|---|
Exceeded the allowed number of characters in the input field [Title] |
An error is displayed below the field, the Add signal button is inactive |
Exceeded the allowed number of characters |
Required fields are not filled in |
An error is displayed below the field, the Add signal button is inactive |
Required |
Attempt to add a curve with the same name in the |
An error is displayed below the field, the Add signal button is inactive |
A curve with this name already exists |
All numerator coefficients = 0 |
A warning is displayed below the field, the Add signal button is active |
At least one coefficient ≠ 0 |
All denominator coefficients = 0 |
An error is displayed below the field, the Add signal button is inactive |
The denominator cannot be zero |
If the |
An error is displayed under the field/fields, the Add signal button is inactive |
Incorrect format |
|
An error is displayed under the field/fields, the Add signal button is inactive |
The frequency cannot be zero |
|
An error is displayed below the field, the Add signal button is inactive |
End frequency cannot be less than start frequency |
3. Adding a signal#
When you click the Add signal button, the system:
Constructs a
Transfer functionbased on the entered data (see Fig. 3 below).Adds a new signal to the existing chart (if it is already displayed).
Displays the signal name in the list next to the graph.
Note
If you edit any parameters other than the name in an already added signal, then in order to apply these changes you must:
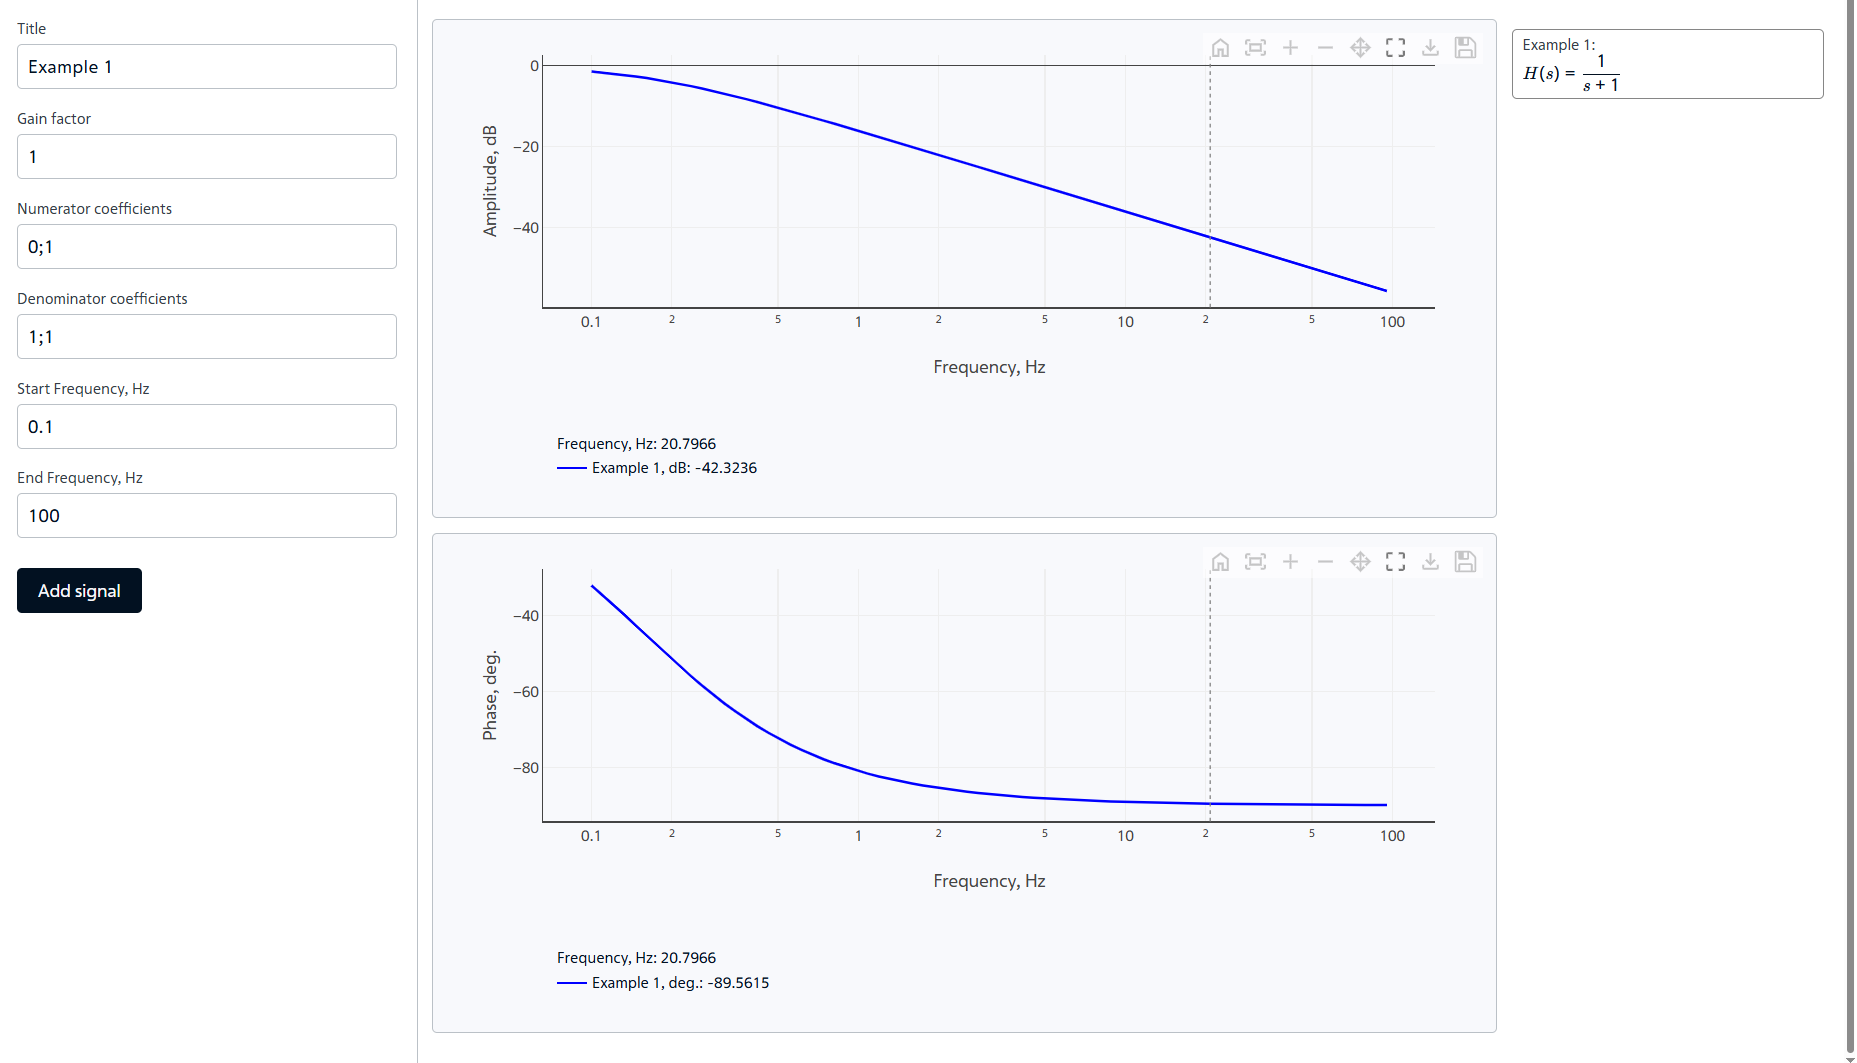
Fig. 3 Example of constructing Transfer function#
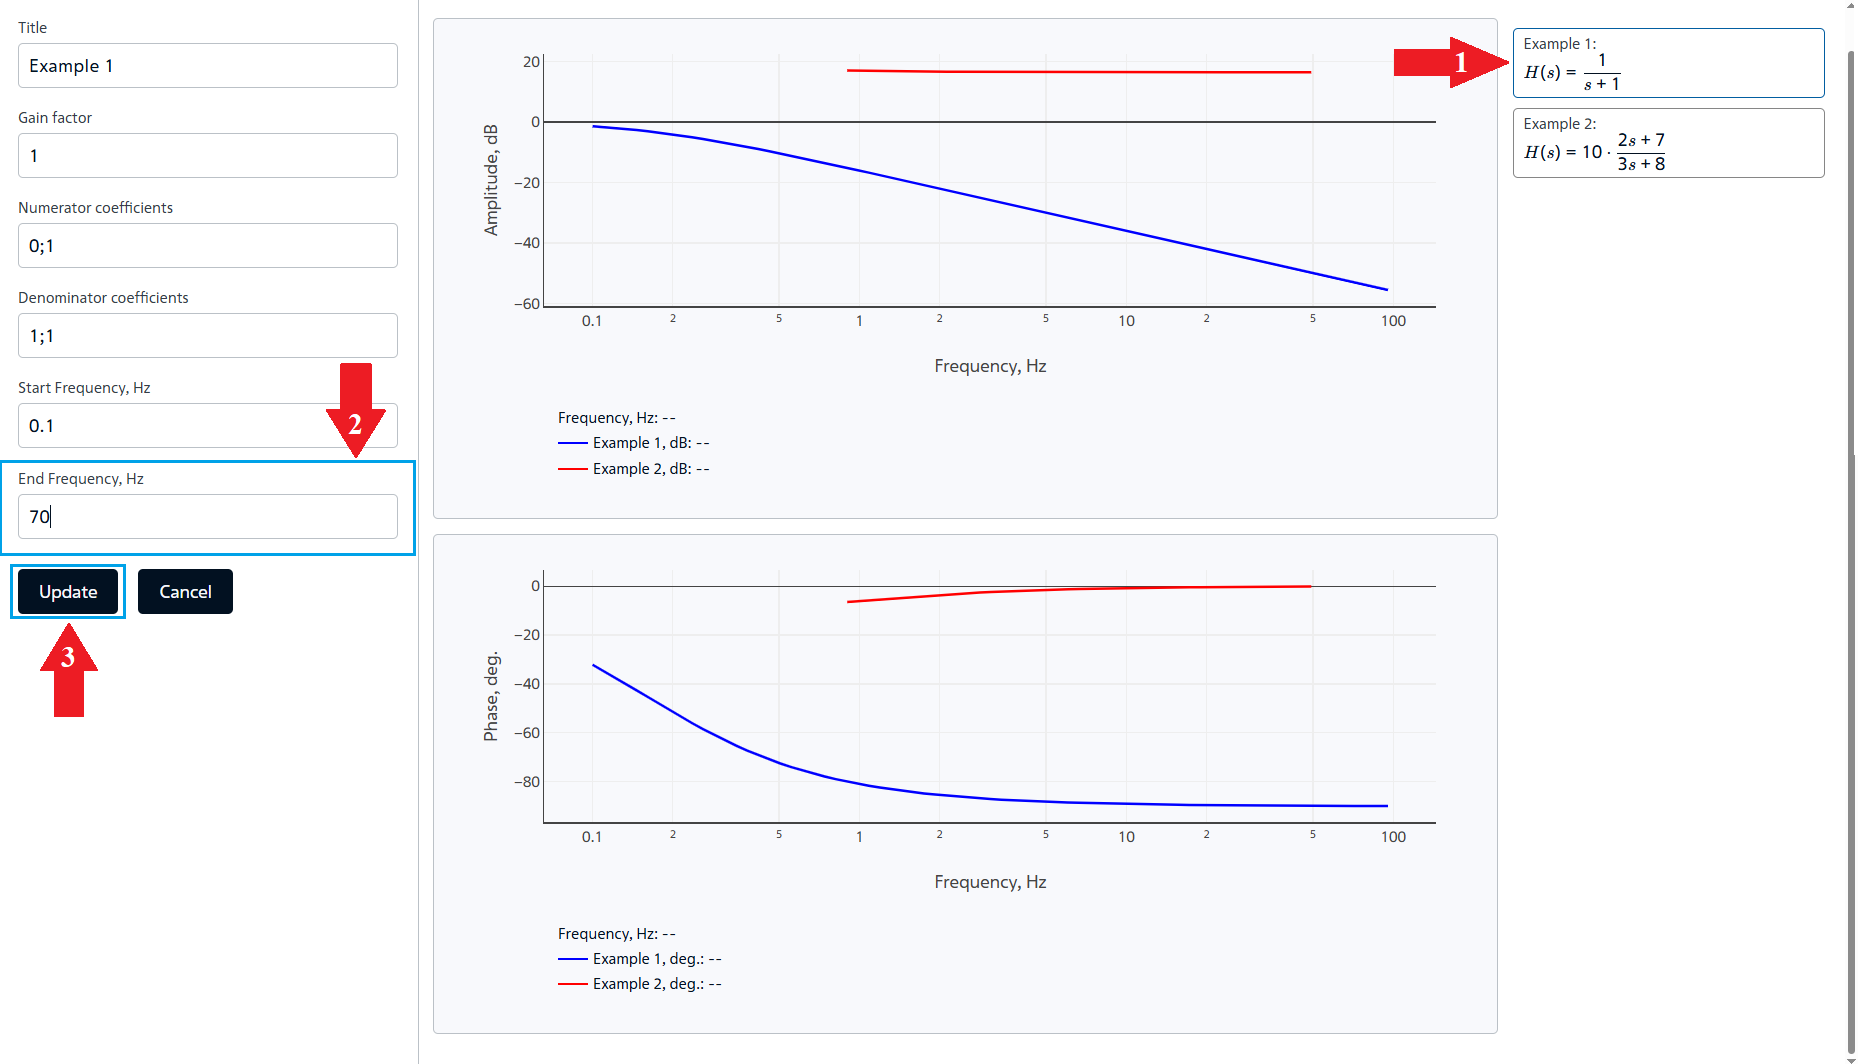
Fig. 4 Example of updating changes in signal parameters#
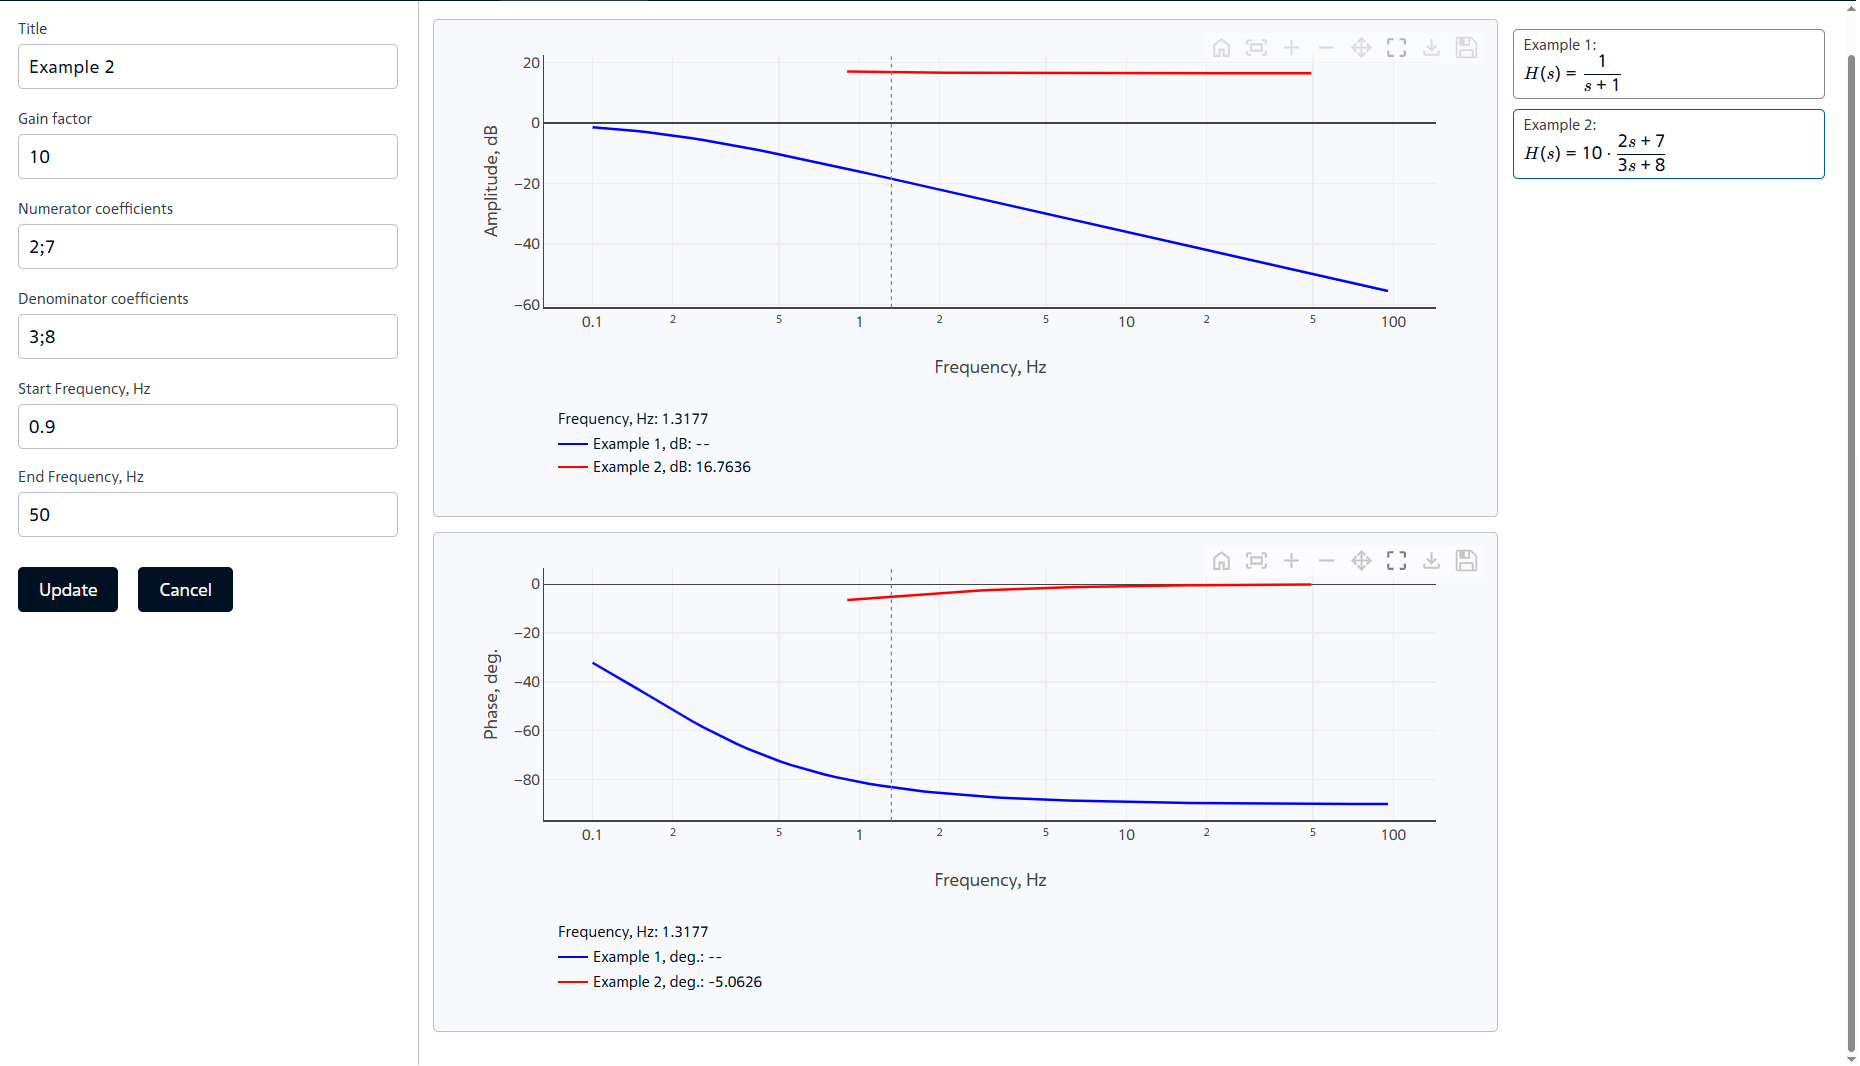
Fig. 5 Example of adding a second signal#
Note
New signals are displayed to the right of the charts.
4. Signal management#
You can switch between signals by clicking on their function, located to the right of the graphs, LMB.
The signal can be hidden from the charts by clicking on the
 button next to the function.
The signal can be deleted by clicking on the
 button next to the function.
Note
After deletion, the chart is updated to exclude the deleted signal.
5. Schedule management#
Hint
Each curve (signal) has a unique line color that is automatically assigned when added.
The chart is controlled using a panel that appears in the upper right corner of the chart when you hover the cursor over the chart itself (Fig. 6):

Fig. 6 Chart control panel#
Button |
Function name |
Description |
|---|---|---|
|
Rese views |
Return to fixed axis values |
|
Autoscale |
Adjusts the chart to the current data |
|
Zoom in |
Approximation of the schedule |
|
Zoom out |
Removing the schedule |
|
Pan |
Allows you to move the graph within the canvas |
|
Zoom |
Allows you to zoom in on the graph in the selected area |
|
Download plot |
Allows you to save the graph in |
|
Download |
Allows you to download a |


Note
Data is exported only for visible signals